Open Access
Research Article
Max Screen >>
ISSN: 2393-9060
Copyright: © 2014 Turconi G. This is an open-access article distributed under the terms of the Creative Commons Attribution License, which permits unrestricted use, distribution, and reproduction in any medium, provided the original author and source are credited.
Related article at Pubmed, Google Scholar
Childhood obesity has been described as the main health-related problem in developed countries, due to its link with physical, social and psychological consequences with an increased risk for developing metabolic and cardiovascular diseases in adulthood.
All the pupils of both sexes attending the second year of all the primary schools in Pavia, Northern Italy, were recruited (n=470) for this study. Measurements of weight, height and waist circumference (WC) were taken under standard conditions. Body Mass Index (BMI) and waist-to-height-ratio (W/HtR) were computed and sex specific percentile values for BMI, WC and W/HtR were calculated and compared with the same percentiles available for different countries.
The results show that according to Cole’s cut-off point reference standards, 12.5% and 9.0% of boys and girls respectively are overweight, 4.7% and 5.2% respectively are obese. The WC mean value is equal to 60.0 ± 6.0 cm in boys and 59.0 ± 6.7 cm in girls. Using different 90th reference worldwide standard percentiles for WC as a comparison, the prevalence of our children with WC > 90th percentile is very different. The W/HtR mean value of the total sample is 0.46 ± 0.03. Assuming a cutoff of 0.5, 87.6% of the pupils have a W/HtR value ≤ 0.5, while 12.4% of the subjects have a value > 0.5, showing abdominal obesity among 55 children at an early age.
Our results point out the need for specific preventive and treatment interventions by identifying and implementing effective strategies, policies, and nutritional education programs in order to decrease the prevalence rate of obesity as well as the risk of metabolic disorders.
Keywords: Overweight/obesity; Abdominal obesity; BMI; Waist circumference; Waist-to-height-ratio
List of abbreviations BMI-Body Mass Index; WC-Waist Circumference; W/HtR-Waist-to-Height-Ratio; IASO-International Association for the Study of Obesity; IOTF-International Obesity Task Force; WHO- World Health Organization
Children’s obesity has been described as the primary health-related problem worldwide, due to its link with physical, social and psychological consequences. Its prevalence rate is rising almost universally [1-4] with an increased risk for developing chronic diseases such as type 2 diabetes, cardiovascular diseases and a variety of other co-morbidities before or during early adulthood.
Overweight children enter adulthood with an increased risk of adult obesity of up to 17-fold, while adult obesity in turn carries an increased likelihood of metabolic and cardiovascular diseases, certain cancers and a range of other disorders. Even if subsequent weight loss is achieved and maintained, there is evidence that mortality rates are higher among those adults who had been obese as adolescents [5].
The prevalence of overweight and obese children is dramatically higher in economically developed regions, but is rising significantly in most parts of the world [2,4]. Once considered a problem only in high income countries, the prevalence rate is now dramatically on the rise in low- and middle-income countries, particularly in urban settings.
The most recent data from the International Association for the Study of Obesity (IASO) [4] show that in the WHO Regions prevalence of overweight and obesity, respectively in boys and girls, is 1.9% and 2.6% in African Regions, 27.3 % and 26.3% in American Regions, 15.2% and 16.6% in the Eastern Mediterranean Regions, 22.1% and 20.3% in European Regions, 14.2% and 7.0% in South East Asian Regions, 17.7% and 12.7% in Western Pacific Regions.
Waist circumference (WC) is recommended as a means of identifying people at risk of morbidity associated with central adiposity, especially with the risk of cardiovascular and metabolic disease, and it has been shown to be a highly sensitive and specific marker of upper body fat accumulation also in children [6]. The associated lipid abnormalities and insulin concentrations also correlate with WC [7,8]. WC represents the intra-abdominal fat that is thought to be more metabolically active, and it helps to predict cardio-metabolic risk even in patients with a normal BMI (‘‘metabolically obese individuals’’). However, stature influences the magnitude of WC throughout growth in childhood. Thus WC measurement, either alone or in combination with stature, might offer a more sensitive mean than BMI for identifying overweight and obese children who might be at an increased risk of developing metabolic complications.
To identify children at risk for the metabolic syndrome, different WC cut-off percentiles have been proposed. According to Maffeis et al. [9] children with a waist circumference > 90th percentile are considered to have abdominal obesity. The 90th percentile is also recommended in the International Diabetes Federation (IDF) definition for metabolic syndrome [10]: increased WC > 90th percentile is used as the “sine qua non” factor for diagnosing the syndrome.
Recently, many authors [9,11-14] suggested the weight-to-height-ratio (W/HtR) as a measure of excess central adiposity, correcting the WC for the height of the individuals, since it has been shown to more readily identify youth with adverse cardiovascular risk factors compared to WC and body mass index (BMI) [9,11]. The rationale underlying this index is that, for a given height, there is an acceptable degree of fat stored on the upper body. Since the W/HtR takes into account children’s height, a single cut-off point can likely be set for the ratio, without age and gender difference bias [14]. In addition, it has been shown to be a simple, non-invasive and practical tool that correlates well with visceral fat and it is easier to use [11-14]. In the small number of studies that have examined this index in children, W/HtR has been shown to be superior in its ability to predict cardiovascular disease risk factors compared to either BMI or percentage of body fat [13]. The correction of WC for height offers the advantage that a single W/HtR boundary value may be useful in different ethnic, age and sex groups [15,16], while WC requires population-specific boundary values [1]. A W/HtR cut-off-point of 0.5 has been proposed as a simple means of indicating whether the amount of central adiposity is excessive and represents a health risk in children [9,11-15]. The weighted mean boundary value of 0.5 supports the simple public health message “keep your waist circumference to less than half your height” [11,15].
The aim of this study was to assess in a sample of Italian children the prevalence rate of overweight, obesity and abdominal obesity by means of weight, height and waist circumference (WC) measurements under standard conditions, then to compute Body Mass Index (BMI), waist-to-height-ratio (W/HtR) and sex specific percentile values for BMI, WC, W/HtR and finally to compare them with the same percentiles available for different countries.
All children of both sexes attending the second year of all the primary schools (n=13) in Pavia, Northern Italy, were recruited (n=470) in 2012. Four hundred and forty eight healthy subjects (95.3% of the entire sample) participated in the study, 52.5% males and 47.5% females, among whom 71 were from non-European countries, recently immigrated or born in Italy. Twenty two children, 16 Italians and 6 foreigners, refused to undergo anthropometric measurement assessment, since their parents were not interested in the project. None of the eligible children was mobility impaired nor disabled nor with medical condition that might affect their anthropometric measurements.
The mean age of the sample is 7.7 ± 0.4 years (range 7-8.5), with a prevalent distribution between 7.5 (51.8% of subjects) and 8 years (37.1 %). Six Italian children and ten foreigners were aged above eight years. We decided to select only the second year primary school pupils, as we intend to follow up the children until the last year of primary school after a nutritional education intervention provided by the school teachers. This study was carried out as part of a wider nutritional surveillance project conducted with the cooperation of the Education Department of Pavia City Hall, which also included investigation into the meals consumed in school canteens, dietary habits of children and their families, children’s physical activity level as well as the family’s educational level and SES and parents’ BMI. All students were surveyed over the course of three months, from April to the end of May 2012.
The survey was conducted with the cooperation of both the school teachers and the Education Department of Pavia City Hall. Before starting the study, the research team organized many meetings together with teachers to explain the aim of the research and to request their participation. After then, students and their parents were informed of the study by means of assemblies in each school as well as they were provided with a written document in which the research relevance in the context of a nutrition surveillance program was outlined. Finally they were invited to participate in the study. Informed written consent was obtained from them by means of a signed letter that the pupils gave back to their teacher. Only 22 remainder calls were needed just once to return consent form.
The study was conducted according to the guidelines laid down in the Declaration of Helsinki and all procedures involving human subjects were approved by the Ethics Committees of Pavia University Medical School.
All the subjects were examined by two trained dietitians after setting up a classroom as a clinic in each school. The dietitians had received 8 hours of instruction and had been standardized in the measurement assessments. A subset of children (20 males and 20 females) was measured by the two dietitians to determine intra- and inter-operator variability, which was < 3% for all the measurements (Kappa reliability test).
The assessment was carried out during school hours in the late morning, about an hour before lunch, subject to an appointment with the school teachers.
Measurements of weight, height and waist circumference were taken under standard conditions [17]:
Body height measured to the nearest 0.5 cm on subjects without shoes by means of a stadiometer (precision ± 1 mm);
Waist circumference (WC) measured to the nearest 0.5 cm in duplicate according to standard conditions, by placing a flexible tape midway between the lowest rib and the iliac crest. The tape was snug, but did not squeeze or compress the skin, and was parallel to the floor. The measurement was taken on unclothed, relaxed subjects, after gently exhaling.
BMI was calculated as the ratio between weight (in kilograms) and the square of height (in meters). W/HtR was calculated as the ratio between waist and height both measured in centimeters.
In accordance with the International Obesity Task Force (IOTF) [18], Cole et al.’s cut-off point reference standards for BMI [19] were used to identify overweight and obesity at a young age. Cole’s percentile curves were drawn so that at age 18 years they passed through the widely used cut-off points of 25 and 30 kg/m2 for overweight and obese adults. The resulting curves were averaged to provide age- and sex-specific cut-off points from 2 to 18 years. The IOTF [18,20,21] suggests that Cole’s cut-off points are less arbitrary and more internationally based than current alternatives (they were developed by measuring 97,876 males and 94,851 females from birth to 18 years of age living in Brazil, Great Britain, Hong Kong, The Netherlands, Singapore and the USA [19]) and will help to provide internationally comparable prevalence rates of overweight and obesity in children and adolescents.
Children with a waist circumference > 90th percentile were considered to have abdominal obesity [9,10]. The ratio between waist and height (W/HtR) was calculated and a cutoff of 0.5 used to differentiate low W/HtR from high W/HtR was chosen [9,11,15,16].
Data were processed using the Statistical Package for the Social Sciences version 18 for PC (SPSS Inc., Chicago, IL, USA). Descriptive statistics (means and standard deviations) and frequency distribution were calculated. Percentile regression was used to model the regression lines of the 3rd, 5th, 10th, 25th, 50th, 75th, 90th, 95th and 97th percentiles of the distribution of BMI, WC and W/HtR.
Out of 448 subjects who agreed to participate in the study, 442 children underwent anthropometric assessment measurements, since during the days of investigation 6 subjects were at home due to illness. As reported above, the mean age of the sample is 7.7 ± 0.4 years (range 7-8.5), with a prevalent distribution between 7.5 (51.8% of subjects) and 8 years (37.1 %).
Age and anthropometric measurements of the sample are presented in Table 1. Mean BMI value is equal to 16.4 ± 2.4 kg/m2 for boys and 16.2 ± 2.6 kg/m2 for girls. According to Cole’s cut-off point reference standards, 12.5% and 9.0% of boys and girls respectively are overweight, while 4.7% and 5.2% respectively are obese. Overall, 15.9% of the all sample are overweight and obese. Weight, height and WC are slightly higher in boys than in girls, while the other anthropometric measurements are similar in both groups. The prevalence rate of underweight and obese subjects is higher in girls; overweight prevalence is higher in boys and normal weight children are similar in the two groups. Sex specific percentile values for BMI are shown in Table 2.
Referring to Cole’s reference standard percentiles, Figure 1 shows pupils’ BMI values illustrating normal distribution, without any difference between boys and girls. By analyzing the sample subdivided between Italian and foreign children, the prevalence rate of underweight children is higher in Italian when compared to foreign subjects (15.1% vs 4.2%; p< 0.05); normal weight rate is similar in the two groups (70.9% vs 70.4%) while overweight and obesity rate is higher in foreign pupils (25.4% vs 14.0%; p< 0.01). We point out that the foreigners come from various (n=23) non-European countries (Northern, Central and South America, Northern and Central Africa, East Asia and the Middle East) with different ethnic and cultural lifestyles.
The WC mean value is equal to 60.0 ± 6.0 cm in boys and 59.0 ± 6.7 cm in girls. Sex specific percentile values of our sample for WC are shown in Table 2. Our WC 50th percentile is then compared with the same percentile in different populations at 8 years of age in Table 3.
Using different 90th reference worldwide standard percentiles for WC as a comparison, the percentage of our children with WC > 90th percentile is very different, ranging from 1.3% (Mexico City) to 28.4% (UK) for boys and from 0.8% (Central Italy) to 29.8% (UK) for girls, as shown in Table 4. Assuming a cutoff of 0.5 (≤ 0.5 and >0.5) used to differentiate low W/HtR from high W/HtR, the W/HtR mean value of the total sample is 0.46 ± 0.03 showing a value under 0.5. Sex specific percentile values for W/HtR are provided in Table 2. Eighty-seven point six percent of the children have a W/HtR value ≤ 0.5, while 12.4% of the subjects (n=55; 11.6% of boys and 13.3% of girls) have a value >0.5, of whom 9.7% are overweight and obese subjects.
When the value of the W/HtR that corresponds to the 50th percentile in this study is compared with the same available reference standard percentiles, our value for both genders lies between the 50th and 75th percentiles of Shandong children [th], between the 50th and 75th percentiles of Hong Kong children [23] for boys and between the 75th and 90th percentiles for girls, and at the 50thpercentile of Swiss children [24] for boys and between the 5th and 50th percentiles for girls.
This study, carried out as part of a wider nutritional surveillance project, was aimed at assessing in a sample of Italian children the prevalence rate of overweight, obesity and abdominal obesity as indicative risk of cardiovascular and metabolic diseases, and comparing our population with similar studies.
In the current study, the prevalence rate of overweight and obese subjects is higher in males (17.2%) than in females (14.2%). The value in the total sample is equal to 15.9% and is lower than the most recent Italian national data collected in 2012. A cross-sectional survey carried out by the Italian Ministry of Health and coordinated by the National Institute of Health on 46,483 students aged 8-9 years (OKkio alla Salute Surveillance Project, 2012 [25]) shows that out of the children weighed and measured using the international standardized methodology, 32.8% were overweight or obese, with the highest percentage in central (>35%) and southern (>40%) Italy. Indeed, the national data subdivided according to geographical areas show in Lombardy Region a prevalence rate of overweight and obesity decreasing from 25-33% in 2008 to ≤ 25% in 2012 [25,26].
Our data are encouraging and are in line with those of a study carried out by Brambilla et al. in 2012 in Milan [27], northern Italy, reporting a decrease in the prevalence rate of overweight and obesity in 2,117 children aged 5-6 years from 23.1% in 2001 to 16.6% in 2011. In addition, they are in line with international epidemiological data [28] referring to nine European and non-European countries (Australia, China, England, France, Netherland, New Zealand, Sweden, Switzerland and USA) collected on 467,294 children aged 2-19 years, reporting that the increase in prevalence of overweight and obesity has slowed appreciably, or has even plateaued.
Therefore, it might be supposed that the childhood obesity epidemic is decreasing, but it should also be pointed out that our data and those collected in Milan and in Lombardy Region refer to selected age groups of children (7-8 years in Pavia, 5-6 years in Milan and 8-9 years in Lombardia) and to a specific area in Italy, then they need further in-depth studies to exclude a shift in the onset of overweight and obesity in adolescence.
From 1995, WC by itself was proposed as an alternative measurement for central or abdominal obesity [29], since BMI gives no indication about body fat distribution. WC is strongly correlated with abdominal fat measurements from advanced imaging techniques, and is thought to represent fat stored in visceral deposits [15].
To date, there are no international reference standard percentile values for WC. Thus, considering the influence of age, gender and ethnicity on this anthropometric index, different countries worldwide provided WC percentile curves for children by age and gender, aimed at defining the mean and distribution of WC at each age, so that WC requires population specific boundary values [1].
Therefore, our 50th percentile value for boys and girls, compared with those listed in Table 3, are higher than those in Poland [30], Turkey [31], UK [32], Hong Kong [23] and China [22] and lower than those in United States [33], Mexico City [34], Pescara [35] and Chile [36]. Germany [37] shows 50th percentile values closer to ours. We compared our percentile curves also to those provided for Central Italy (Pescara) as a reference standard [35] although these values refer to a small town in a specific Italian region and were moreover collected a long time ago (1996), nevertheless they are the only available for Italian children.
Since children with a WC >90th percentile are considered to have abdominal obesity and to be at risk of metabolic syndrome [9,10], when we refer to the 90th percentile value of those standards, the percentage of our children with WC >90th are extremely different (Table 4), ranging from 1.3% (Mexico City [34]) to 28.4% (UK [32]) for boys and from 0.8% (Pescara [35]) to 29.8% (UK [32]) for girls.
This may be due to the influence of ethnicity, genetics, different dietary habits and body shape in various countries, although comparison of WC data between different studies needs to be undertaken with caution since WC may be measured at four different anatomical sites as reported by Browning et al. [15] in a systematic recent review: the minimum WC, WC at or 1cm from the umbilicus, WC at the midpoint between the xiphisternum and the umbilicus or using the WHO definition of halfway between the lower rib and the iliac crest.
Moreover, WC may over and under evaluate risk for tall and short subjects with similar WC. In addition, the time that the data were collected in the various countries could reflect different phases of the global obesity epidemic. Therefore, it is very difficult to correctly identify those children at risk of central obesity and cardiovascular and metabolic disorders.
These observations suggest the need to undertake further studies in various countries worldwide in order to obtain WC percentiles curves which could be used at international level as Cole’s BMI curves.
Another useful anthropometric measurement to better define abdominal obesity is W/HtR, which is increasingly used to assess the risk for diseases related to visceral fatness in adults [38-41] as well as in children [9,11-14]. Since the W/HtR takes children’s height into account, a single cut-off point (>0.5) can likely be set for the ratio, without age and gender difference bias [14].
Ashwell and Hsieh [16] suggested a few reasons why the W/HtR is a rapid and effective global indicator for health risks of obesity and how its use could simplify the international public health message on obesity. Among these, the most important are the following: a boundary value of WHtR of 0.5 indicates increased risk for men and women; it may indicate increased risk for individuals in different ethnic groups; it may allow the same boundary values for children and adults. However, it is recognized that WC can be measured at a variety of different sites and therefore only one standard site should be used for the measurement.
According to this cut-off point, 12.4% of our subjects (n=55) have a value >0.5, among them 9.7% are overweight and obese subjects according to BMI. Our results are in line with those found for children aged eight years in Hong Kong [23] and Shandong (China) [22], are slightly lower than those found in Switzerland [24] and higher than those in UK [11], with the latter showing lower values both for children’s BMI and WC. These results are worrying and need to be taken into consideration, since metabolic syndrome is becoming a very significant health problem in children too [42]. Childhood obesity is a problem of epidemic proportions. Furthermore, the accumulation of fat in the upper segment of the body plays an important role in the pathogenesis of metabolic and cardiovascular diseases also in pediatric age. Our results point out the need for specific preventive interventions by continuing on effective strategies, policies, and nutritional education programs in order to contain the prevalence rate of obesity as well as to decrease the risk of metabolic disorders. In our Lombardy Region health preventive targeting programs aimed at improving a healthy diet, weight status and increasing physical activity are carrying out by the local health institution in each primary school at an early age, involving not only children but also their family and environment.
Our study has a few limitations that must be considered. First, no in-depth analysis was performed when comparing the two groups of Italian and foreign children because of the different number of subjects in each group as well as the various countries of origin of the immigrants (23 non-European countries) with different ethnic and cultural lifestyles. Second, we assessed only second year primary school children since we intend to follow up the children during subsequent years until the last year of primary school and after a nutritional education intervention provided by the school teachers.
The strength of our study is that we compared our results of WC and W/HtR with other data available for various European and non-European countries.
Overweight and obese children are an important public health concern, not only in the developed worlds but also in emerging countries, and abdominal obesity is an established factor for the development of metabolic syndrome also at an early age. Therefore, children with excessive visceral adipose tissue should be observed carefully.
The use of WC measurement cannot correctly identify those children at risk of central obesity and cardiovascular and metabolic disorders, since WC may over and under evaluate risk for tall and short subjects with similar WC and, in addition, it is recognized that WC can be measured at a variety of different sites. As suggested by Ashwell and Hsieh [16] the W/HtR is a rapid and effective global indicator for health risks of obesity since it takes children’s height into account and a single cut-off point can likely be set for the ratio, without age and gender difference bias. Other studies should be carried out in order to provide W/HtR percentiles for children in many countries.
The authors would like to express their acknowledgement to the staff of the Education Department of Pavia City Hall: Dr. R. Faldini, Dr. M. Adduci, Dr. P. Mangiarotti, Dr. F. Gallone, Dr. F. Biffi, Dr. L. La Carbonara. They are very grateful to all the teachers, the pupils and their parents for their continuous cooperation and to the dietitians for the anthropometric measurement assessment.
The research was supported by grants from Pavia City Hall Education Department.

![]()

Total |
Boys |
Girls |
|
Age (years) |
7.7 (0.4) |
7.7 (0.5) |
7.6 (0.3) |
Weight (kg) |
27.3 (5.8) |
27.8 (5.5) |
26.9 (6.0) |
Height (cm) |
129.0 (5.6) |
129.8 (5.2) |
128.2 (5.8) |
BMI (kg/m2) |
16.3 (2.5) |
16.4 (2.4) |
16.2 (2.6) |
Waist Circumference (WC) (cm) |
59.5 (6.3) |
60.0 (6.0) |
59.0 (6.7) |
Waist-to-height ratio |
0.46 (0.03) |
0.46 (0.04) |
0.46 (0.03) |
Under weight subjects’ BMI (kg/m2) |
13.3 (0.5) |
13.5 (0.5) |
13.2 (0.5) |
Normal weight subjects’ BMI (kg/m2) |
15.9 (1.0) |
15.9 (1.2) |
15.9 (1.4) |
Overweight |
19.7 (1.0) |
19.6 (0.9) |
20.0 (1.1) |
Obese subjects’ BMI (kg/m2) |
23.5 (1.7) |
23.4 (1.5) |
23.5 (1.9) |
Percentiles |
BMI |
WC |
W/HtR |
|||
boys |
girls |
boys |
girls |
boys |
girls |
|
3rd |
13.1 |
12.8 |
53.0 |
50.2 |
0.41 |
0.40 |
5th |
13.4 |
13.0 |
54.0 |
51.0 |
0.42 |
0.40 |
10th |
13.9 |
13.6 |
54.0 |
52.0 |
0.42 |
0.41 |
25th |
14.7 |
14.6 |
56.0 |
54.0 |
0.44 |
0.43 |
50th |
16.1 |
15.7 |
59.0 |
57.0 |
0.46 |
0.45 |
75th |
17.5 |
17.1 |
62.0 |
63.0 |
0.47 |
0.48 |
90th |
19.8 |
19.6 |
68.0 |
68.0 |
0.51 |
0.52 |
95th |
21.8 |
22.3 |
73.0 |
75.5 |
0.55 |
0.55 |
97th |
22.8 |
22.7 |
76.0 |
78.0 |
0.57 |
0.56 |
Countries |
WC values (cm) |
Authors |
|
boys |
girls |
||
Our study, Pavia, Northern Italy |
59.0 |
57.0 |
Turconi et al., 2014 |
Pescara, Central Italy |
67.0 |
69.0 |
Zannolli et al., 1996 [35] |
Switzerland |
59.2 |
58.4 |
Aeberli et al., 2011 [24] |
Germany |
58.6 |
57.2 |
Schwandt et al., 2008 [37] |
United Kingdom |
54.7 |
54.1 |
McCarthy et al., 2001 [32] |
Poland |
57.1 |
55.5 |
Ostrowska Nawarycz et al., 2010 [30] |
Turkey |
56.4 |
54.7 |
Hatipoglu et al., 2008 [31] |
Hong Kong |
55.3 |
53.2 |
Sung et al., 2008 [23] |
Shandong, China |
55.8 |
53.7 |
Zhang et al., 2013 [22] |
United States |
59.6 |
58.8 |
Fernandez et al., 2004 [33] |
Mexico City |
62.5 |
60.0 |
Gomez-Diaz et al., 2005 [34] |
|
Countries |
WC values (cm) |
% of children with |
Authors |
||
boys |
girls |
boys |
girls |
||
Our study, Pavia, Northern Italy |
68.0 |
68.0 |
|
|
Turconi et al., 2014 |
Pescara, Central Italy |
77.0 |
79.7 |
1.8 |
0.8 |
Zannolli et al., 1996[35] |
Switzerland |
67.0 |
66.4 |
10.3 |
11.0 |
Aeberli et al., 2011[24] |
Germany |
67.5 |
65.8 |
9.5 |
11.4 |
Schwandt et al., 2008[37] |
United Kingdom |
60.9 |
60.4 |
28.4 |
29.8 |
McCarthy et al., 2001[32] |
Poland |
66.7 |
64.2 |
10.8 |
15.2 |
Ostrowska Nawarycz et al., 2010[30] |
Turkey |
64.4 |
61.9 |
16.4 |
25.2 |
Hatipoglu et al., 2008[31] |
Hong Kong |
66.6 |
61.6 |
10.1 |
26.6 |
Sung et al., 2008[23] |
Shandong, China |
70.0 |
64.0 |
6.7 |
15.2 |
Zhang et al., 2013[22] |
Mexico City |
79.9 |
73.8 |
1.3 |
5.2 |
Gomez-Diaz et al., 2005[34] |
Santiago (Chile) |
77.8 |
77.9 |
1.7 |
1.4 |
Avalos et al., 2012[36] |
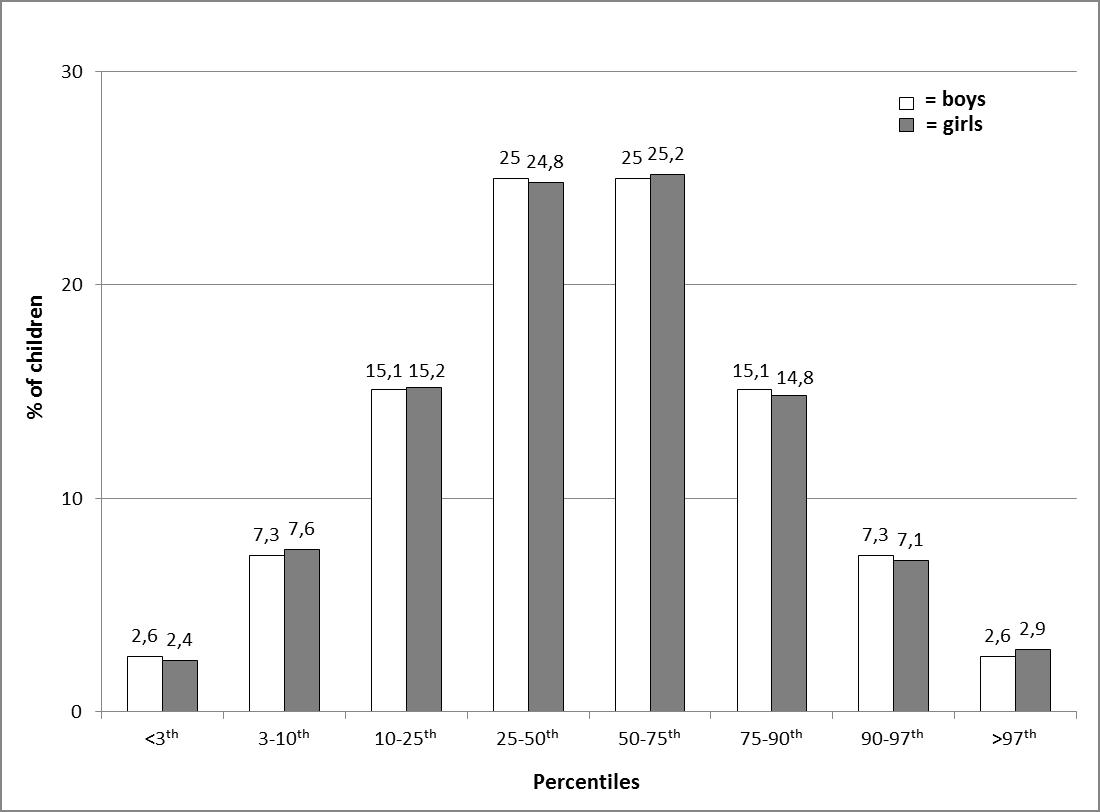 |
| Figure 1: BMI distribution according to Cole’s reference standard percentiles |


