Open Access
Research Article
Max Screen >>
ISSN: 2393-9060
Copyright: © 2016 Chipili G. This is an open-access article distributed under the terms of the Creative Commons Attribution License, which permits unrestricted use, distribution, and reproduction in any medium, provided the original author and source are credited.
Related article at Pubmed, Google Scholar
The Central Province of Zambia contains the majority of the nation’s malnourished children, despite being the most productive province in terms of Agriculture. Most studies in the province have not paid attention to the linkages between agriculture performance and nutrition outcomes of the population. In light of this knowledge gap, this study focused on the linkage between nutrition and agriculture. In 2010 the Ministry of Agriculture in the Central Province while working with Non-Governmental Organizations (NGOs), the Ministry of Health and the Ministry of Education started a pilot project in Kapiri-Mponshi on Orange fleshed Sweet Potatoes and Orange Maize and educating farmers on the importance of crop diversity.
The study assessed the extent to which the small scale farmers are implementing the best practices of nutrition-sensitive agriculture in the Central Province. This study sought to determine the association of crop diversity and nutritional status of children aged 6-59 months in Kapiri-Mposhi district in the Central Province of Zambia. A cross-sectional descriptive study was conducted using a structured questionnaire. A total of 365 households were randomly sampled and the nutritional status of one child from each household assessed using anthropometric measurements. A total of 100 children were included in the study. Up to 21% of the children were stunted; 2% were wasted; and 9% underweight. There was a significant relationship between crops grown in households (ground nuts, mangoes and orange-fleshed sweet potatoes) and Z-scores for stunting (HAZ) and underweight (WAZ) (p<0.05). This study has established that farmers may not diversify if they have high market demands on the staple.
Keywords: Agriculture; Crop diversity; Children; Nutrition
NUTRITION-SENSITIVE agriculture is the undertaking of agriculture that effectively and explicitly incorporates nutrition objectives, concerns, and considerations to achieve food and nutrition security [1]. This concept seems to be picking popularity from organizations such as FAO, IFAD and IFPRI. However, given the high extent of malnutrition in developing countries, it is likely that the implementation of this concept has not been taken seriously in most developing countries, including Zambia.
The agricultural sector continues to be the backbone of the Zambian economy as it contributes to the growth of the economy and also to exports. Primary agriculture contributes about 35% to the country’s total non-traditional exports (i.e. all the country’s exports other than copper and cobalt) and about 10% of the total export earnings for the country [2].
In Zambia, malnutrition prevalence for under-five children currently is still high appearing as stunting 40%, underweight 15% and wasting 6% [3]. The high prevalence of malnutrition in early life means that childhood growth and development are compromised for many Zambians. Severely malnourished children have a much higher risk of dying (5 to 20 times) than their well-nourished counterparts. Such children also have a 50% likelihood of dying if admitted into hospital [4].
Malnutrition in Central Province of Zambia has remained a great challenge despite the success achieved in the production of pulses, nuts and the staple food (maize). On overage, stunting levels in children below five years of age is unacceptably high at 43% (higher than the national average of 40%). The Zambia National Health Survey indicated that many deaths in the Central Province could be prevented if there was effective nutritional strategy by the Ministry of Agriculture [5].
The study was conducted in Kapiri-Mposhi district of the Central Province. The economic base of the district is mainly the agricultural sector. About 90% of the inhabitants depend on agriculture for their livelihood and most of them are peasant farmers. Kapiri-Mposhi district is located 13°97´S; 28°66´E and is 1286m above sea level, covering 15 000 Km² and with a population of about 194 752 inhabitants [6]. According to the Zambian Agro-Ecological Zoning the district is situated in Agro-Ecological Region II with average annual rainfall of 1000 mm. Daily temperatures range from 23 to 25 oC during the rainy season, but can reach 32 oC during the hot season and minimum temperature of below 10 oC during the cold season with intermittent frost occurrence.
A cross sectional survey, both descriptive and analytical in nature was carried out using a pretested structured questionnaire. The questionnaire was designed to assess the nutrition status of children and its association with household crop diversity. The sampling unit for this study was the household with small scale farmers (famers who cultivate less than 2.5 hectors of land) and the respondents were the mothers or the principal caretaker. Verbal consent from all caregivers/mothers of the sampled households was sought before administration of the questionnaire. All the information collected during the survey were treated as confidential and used for the purpose of the survey only. Mulungushi block out of six agricultural blocks was sampled due to nutrition-sensitive agriculture projects that were being implemented by the Ministry of Agriculture. Three agriculture camps (Lukanda, kaunga, Imansa) were purposively selected because they were the pilot camps for the projects. A total of 356 households were selected for the study, by the random numbers method. A child aged 6-59 months was purposively selected for the study from households with children aged 6-59moths. If a household was found with more than one child aged 6-59 months, only the youngest was selected for the assessment. It was assumed that children in the same household are subjected to the same conditions, hence any selected child could represent the household. A total of 100 children were sampled in the survey.
The questionnaires comprised mainly of details on household profiles like age, sex, education level and occupation of household members, household size and marital status of the household heads. Data on sources of income and crop diversity were also collected. Anthropometric measurements were taken for children aged (6-59) months included:
Date of Birth: The date of birth for each child was inquired from the caretaker/mother and cross checked from immunization cards and recorded in months.
Length/Height: The length of each child aged 6-24 months was measured lying flat and centrally on measuring boards placed on a hard flat surface on the ground. The length was read to the nearest 0.1 cm (head and feet against the base of the board and foot piece respectively). The height of children aged above 24 months was measured standing straight on measuring board placed on hard flat surface against a wall with line of sight perpendicular to the horizontal surface. The child’s height was measured to the nearest one decimal place.
Weight: The child was put in the weighing pants and was gently lowered on the standardized Salter scale with the strap of the pant in front. The scale was hanged from a secure position; the child’s weight read to the nearest one decimal place after the scale needle stabilizes.
A total of nine Focus Group Discussions were conducted, three in each sampled Agriculture Camp. There were three types of FGDs. One had males only, the second one had females only and the third one had both males and females. Each group had six community members, one moderator and one note-taker. The moderator and community members sat in a circle while the note-taker sat in the background. The arrangement was done in order to establish some of the gender roles in the community and help both men and women to speak freely of their roles. The discussion focused on the nutrition status of 6-59 moths children and crop diversity.
Three transect walks were conducted, one in each of the study Camps (Lukanda, Kaunga and Imansa) for the purpose of assess crop diversity. A group of five enumerators walked across the camps with a community member, observing, asking questions and listening. The information and observation were captured on the transect sketch (Figure 1).
The Emergency Nutrition Assessment for Standardized Monitoring and Assessment of Relief and Transition (ENA for SMART) was used to compute Z-score (weight-for-age, height-for-age and weight-for-height) according to WHO reference standard (WHO, 2006), taking -2SD as cut-off points (underweight, stunting and wasting). The Statistical Package for Social Scientists (SPSS) version 20 was used to analyze demographic and socio-economic data. Data cleaning was done by running and tabulating all variable frequencies. Frequencies were used to give frequencies in descriptive analysis on socio-demographic characteristics. Independent t-test was used to establish relationships between variables. The measure of household crop diversity score was assessed according the positive responses to the list of crops included in the questionnaire. There were eight groups which included, cereals, roots and tubers, vitamin A rich vegetables, dark leafy green vegetables, other vegetables, vitamin A rich fruits, other fruits and legumes/nuts. If a household grew crops from 1-3 groups it was considered to have low crop diversity, 4-5 medium crop diversity while 6-7 was high diversity score.
The sampled respondents came from three Agriculture Camps in Mulungushi Block. Almost half of the respondents came from Lukanda Camp (48.3%), and the other half was shared between Kaunga (21.8%) and Imansa Camps (28.9%). The household size ranged from two to thirteen people. On the other hand, about 23% of the households were having under-five children of less than 6 months of age, 48% had none while the 22.5% had under-fives of between 6 and 59 months old. The majority of the study population (61.8%) of the interviewed respondents were between 20-39 years of age, and 33.9% were 40 years and above while very 4.3% were below 20 years of age. The study also showed that more females (62.4) were interviewed than men (37.6), and the majority of respondents were married (82%) and most households were headed by men (84%). About 8.7% of the respondents had no formal education, 29.2% attended primary school, majority of the respondents attended secondary level school (48.9) while only 13.2% attained post-secondary. The main occupation was farming. The other sources of income included salaried job (22.2%), small business 53.4% while 24.4% had no other source of income. Nearly half (49.4%) of the households earned below $25 per week, 29.5% earned $25 - $75, while 21% earned more than $75.
The mean crop diversity was 4 groups, with a minimum of 1 and a maximum of 7 out of 8 groups. Cereals were the most popular crops grown (99.2%) by almost all households (orange/white maize, sorghum and millet), followed 78.9% by dark green leafy vegetable (like, grape, chinese cabbage, pumpkin leaves and sweet potato leaves), Legumes and nuts 65.7% which included (bean, groundnuts and soya beans among others), The root and tuber group 60.7% (orange/white sweet potatoes and cassava), vitamin A rich vegetables 54.5% (pumpkins, carrots, red pepper, red cabbage, purple egg plants), other vegetables 51.4% (green beans, okra, onion and tomatoes), fruits were the least grown, with other fruits at 41.3% (Bananas, lemons, and oranges) and vitamin A rich fruits at 39.3% (Mangoes, ripe papaya, peaches and water melons). In terms of crop diversity score, majority of the households (46.5%) had low diversity (<4 groups of crops), and about 27.3% had medium diversity (4-5 groups of crops). Only 26.3% accessed high crop diversity score (6- 8 groups of crops).
A proportion of 45% of the study children were boys and the rest girls. The mean age of the sampled children was 32.5 months, with the youngest being 6 months old and the oldest 59 months old. Overall, 79% of the children had normal height for their age. The prevalence of stunting among the children was 21%. All 21% of these were moderately malnourished with no child severely stunted (Table 1). Up to 98% of the children had normal weight for their height. Prevalence of wasting was 2% and the 2% were moderately wasted. The prevalence of underweight was 9% and all 9% were moderately underweight no cases of severely underweight children. Stunting was lowest in the first year of life and highest in second and third years of life; while underweight and wasting was highest in the fourth year. Prevalence of underweight increased with age from the fourth year of life. No incidence of wasting was observed in the first year of life.
There was a significant association (P<0.05) between crops grown (groundnuts, mangoes and orange-fleshed sweet potatoes), (Tables 2 and 3) It appears that growing of groundnuts in the household was positively affecting the weight (WAZ) and height (HAZ) outcomes of under-five children. Similarly, the growing of orange-fleshed sweet potatoes showed the same pattern. Growing of mangoes had effects on only height (HAZ) and not on the other two indices.
Underweight in Kapiri-Mposhi was significantly associated with growing of groundnuts and orange sweet potatoes, p<0.05 using independent t-test Sign (2-tailed)
Stunting in Kapiri-Mposhi was significantly associated with growing of groundnuts, mangoes and sweet potatoes, p<0.05 using independent t-test Sign (2-tailed)
The study observed low crop diversity in terms of fruits and vegetables especially Vitamin A rich fruits, therefore an indication of how most farmers have concentrated on the staple (maize). Concentration of a single crop may lead to higher productivity, that is likely to result in reduced crop diversity, which in return may result into increasing risk of micronutrient deficiency [7,8]. Similarly, low crop diversity may reduce the diversity of the foods available in the local market and thus reduce dietary diversity for the net food buyers [9]. A study done in Kenya found that in areas where cassava was a major food that was grown, it was noted that it was very difficult for household to practice diversification of crops [10]. The high percentages of farmers who grow cereals and tubers may mean high consumption of these foods, therefore an indication that the surveyed households are not meeting their micronutrient needs. Another contributing factor for a high cereal percentage is that maize has a very good market in Kapiri-Mposhi because the government of Zambia through the Food Reserve Agency (FRA) buys maize from small and medium scale farmers thus affecting the growing of other crops that have low market demand [11]. Literature shows that even if a crop is useful for home consumption, farmer’s ability to sell the excess produced is an important motivating factor for continued production [12].
The prevalence of stunting observed in Kapiri-Mposhi district was 21%. The majority of stunted children were aged between18-59 months in this study. This could be due to the fact that younger children were still receiving special care including breast feeding while the older children depended on meals from the family pot. A similar case was found in Kenya where stunting was lowest in the first year of life and highest in second to fifth year of life [13].
The prevalence of underweight was found to be 9% in Kapiri-Mposhi with most affected children coming from 42-59 months age group. The same pattern was observed in Burkina-Faso and Nigeria where most of the underweight children were of 40 months and above [14,15]. Overall prevalence of underweight in children of less than 5 years of age in this study would be classified as low because it is less than 10% according WHO classification [16].
The wasting prevalence of 2% was observed in this study and it only affected children in the fourth year of life. A similar case was also found in Kenya where wasting did not affect the first years of life. The age of children who were found to be wasted were between 42-53 months old. The results agree with reports from other studies where wasting was analyzed with the use of WFP Food Aid as the primary source of food and 40-53 months old children had a borderline significant decreased risk of being wasted [17].
The main finding of the study was that household growing of specific crops was associated with stunting and underweight but not wasting among children aged 6 to 59 months in Kapiri-Mposhi. Growing of orange fleshed sweet potatoes was positively associated with weight-for age Z-scores (WAZ) and height-for-age (HAZ). Growing of mangoes was associated with WAZ while growing of groundnuts was associated with WAZ and HAZ. This evidence suggests that growing, and most likely consumption of vitamin A rich crops (orange fleshed sweet potatoes and mangoes) improves the nutrition status and growth of under-five children. A similar case was found in Mozambique where orange fleshed sweet potato (OFSP) dissemination and promotion resulted in increased consumption of OFSP and increased serum retinol of children under-five years of age in a population where Vitamin A deficiency was prevalent [18]. Growing of groundnuts, which is a good source of protein, also improved the growth of children if consumed in recommended amounts. A similar case was found in Malawi which is also a maize dominating country where groundnuts improved the nutrition status of under-fives [19].
Substantial evidence shows that crop diversity is among the key determinants of the nutritional status of children [20,21]. Crop diversity is among the best practices of nutrition-sensitive agriculture FAO [22]. However, there was no association between crop diversity and the nutrition status of children.
Whereas crop diversity may be a necessary prerequisite for good nutrition outcomes, it is insufficient on its own. A study suggest that the influence of crop diversity and access on the nutritional status of children can be confounded by other key determinants of child nutrition such as food availability, maternal nutrition knowledge and healthcare practices, maternal nutritional status, intra-household food allocation and utilization, access to health services, and healthful environmental conditions such as good hygiene and sanitation [23]. While this can explain to some extent the lack of relationship between growing of some crops and nutrition status of under-five children, it may also be true that crops possess some nutrients which are crucial in improving nutrition status.
The authors thank Sokoine University of Agriculture (SUA) for examining this paper and the Ministry of Agriculture in Zambia for assistance during data collection. This publication is a product of a dissertation submitted in partial fulfilment of a degree of Master of Science in Human Nutrition (MSc HN) at SUA.

![]()

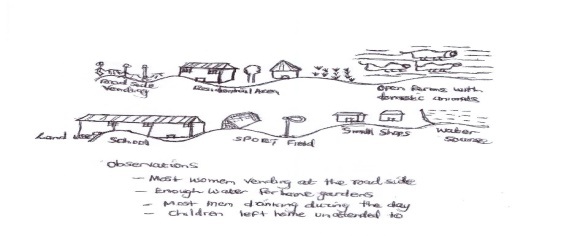 |
Figure 1: Transect sketch |
Indicator |
n |
Mean z-scores ± SD |
Design Effect (z-score < -2) |
z-scores out of range |
Prevalence rate in % |
|---|---|---|---|---|---|
Weight-for-Age (WAZ) |
100 |
-0.5±0.86 |
1.00 |
0 |
9 |
Height-for-Age (HAZ) |
100 |
-1.23±1.12 |
1.00 |
0 |
21 |
Weight-for-Height
(WHZ) |
100 |
0.14±1.05 |
1.00 |
0 |
2 |
Table1: Mean Z-Scores, Design Effects |
|||||
Crop diversity indicators |
N = 100 |
WAZ |
|
|---|---|---|---|
Means ± SD |
P-value |
||
Groundnuts No |
82 |
-0.84 ± 0.91 |
0.004 |
Yes |
18 |
-0.31 ± 0.77 |
|
Mangoes No |
32 |
-0.68 ± 0.95 |
0.58 |
Yes |
62 |
-0.35 ± 0.76 |
|
orange Sweet potatoes No |
35 |
-0.75 ± 0.83 |
0.015 |
Yes |
65 |
-0.32 ± 0.83 |
|
| Table 2: Relationship between Crops Grown and Under-Five Nutrition Status | |||
Crop diversity indicators |
N = 100 |
HAZ | |
|---|---|---|---|
Means ± SD |
P-value |
||
Groundnuts No |
82 |
-1.64 ±1.03 |
0.001 |
Yes |
18 |
-0.83 ± 1.16 |
|
Mangoes No |
32 |
-1.39 ± 1.2 |
0.040 |
Yes |
62 |
-0.89 ± 1.12 |
|
orange Sweet potatoes No |
35 |
-1.55 ± 1.09 |
0.003 |
Yes |
65 |
-0.82 ± 1.15 |
|
Table 3: Relationship between crops grown and under-five nutrition status |
|||


