Open Access
Research Article
Max Screen >>
ISSN: 2348-9782
Copyright: © 2013 Shah T. This is an open-access article distributed under the terms of the Creative Commons Attribution License, which permits unrestricted use, distribution, and reproduction in any medium, provided the original author and source are credited.
Related article at Pubmed, Google Scholar
Mycophenolic Acid (MPA) is one of the most widely used immunosuppressive agents in kidney transplantation. This study was designed to compare the safety, tolerability and efficacy of two formulations of mycophenolic acid, Mycophenolate Mofetil (MMF) and Enteric-Coated Mycophenolate Sodium (EC-MPS), in renal transplant recipients.
This was an open label, prospective randomized clinical trial carried out in two medical centers (St. Vincent Medical Center and the University of Southern California) in a total of 137 patients.
Significantly fewer of the patients treated with EC-MPS required dose reductions than MMF patients, especially early after transplant at 1 month (2.9% vs. 16.4% of patients, respectively, p=0.008) and 3 months (7.3% vs. 29.5% of patients, p=0.001). In addition, there were almost twice as many episodes of acute allograft dysfunction and biopsy-proven rejection in the MMF-treated group compared with the EC-MPS-treated group. Otherwise, the adverse events and tolerability profiles of the two agents were very similar and not significantly different at six months.
The enteric-coated formulation, EC-MPS, appears to have some advantages over MMF in terms of maintenance of an effective dose and a trend towards fewer episodes of rejection in an early clinically important transplant period.
Keywords: Mycophenolic acid; Kidney transplantation; Drug tolerability; Transplant outcomes
List of Abbreviations: MPA: Mycophenolic Acid; MMF: Mycophenolate Mofetil; EC-MPS: Enteric-Coated Mycophenolate Sodium
Mycophenolic Acid (MPA) an antibiotic derived from a Penicillin species [1]. It is a non-competitive inhibitor of inosine monophosphate dehydrogenase and, therefore, blocks the de novo pathway of DNA synthesis, which is required for lymphocyte proliferation [2,3]. Mycophenolic Acid (MPA) was shown to be immunosuppressive in rodents [4] and then in humans [5-7]. Derivatives of MPA are now widely used as immunosuppressive agents in organ transplant recipients. Mycophenolic Acid (MPA) is relatively safe, but many patients (40-45%) suffer gastrointestinal complications that dictate dose reduction or withdrawal [8]. This reduction of MPA therapy has been associated with acute rejection and graft loss [9,10].
There are two formulations of MPA being used in transplant recipients and their chemical structures are depicted in Figure 1. The first is the mofetil ester of Mycophenolic Acid (MMF, CellCept®, Roche Laboratories, Nutley, New Jersey). The second is an Enteric-Coated Formulation Of Sodium Mycophenolate (EC-MPS; Myfortic®, Novartis Co., East Hanover, New Jersey).
Orally-administered MMF is rapidly hydrolyzed and releases MPA. This is absorbed into the circulation, generally with a maximum plasma concentration at about 2 hours. MPA is then glucuronidated in the liver to MPAG, an inactive metabolite which is excreted mostly by the kidney. However, some MPAG is returned to the intestine via the bile duct, so called entero-hepatic recirculation, where it is reactivated by bacterial enzymes [11]. MPA can also be acylated, and this entity may be particularly toxic to enterocytes [8]. However, esophagitis and gastritis are more likely due to MPA itself.
The enteric-coated form of MPA is maximally released at pH 6.0-6.8, beyond the esophagus and stomach in the more alkaline environment of the small intestine [12]. The rationale for the introduction of the enteric-coated formulation was that, because it is absorbed lower in the intestine, it would have fewer gastrointestinal side-effects. Thus, the dose would not be limited by intolerability, leading to better graft outcomes with EC-MPS. Some studies have indicated that this may be so [13-17], but there are conflicting reports too [18-20]. Apart from the gastrointestinal problems peculiar to MPA, the major potential side effect of any anti-proliferative agent is myelosuppression, leading to leukopenia or anemia. In the original multicenter MMF trials these adverse events were infrequent [5-7].
This study was designed to compare drug tolerability and outcomes using equivalent doses of MMF and EC-MPS in renal transplant recipients during the first six months after transplantation.
This study was an open label, prospective, randomized trial. It was conducted in adult de novo renal transplant recipients transplanted at St Vincent Medical Center, Los Angeles (SVMC, n=100) or at the University of Southern California University Hospital, Los Angeles (USC, n=37). Institutional Review Board approval was obtained at both centers. Seven of the consented patients were excluded from the final analyses because of withdrawal from the study, five at SVMC and two at USC. Of the remaining 130 patients, 61 were treated with MMF (CellCept®) and 69 received EC-MPS (Myfortic®) (Table 1).
Exclusion criteria included women with child-bearing potential during the study, known sensitization to study drugs or class of study drugs, incompatible blood type, the second or subsequent transplant or another organ at the time of renal transplantation, or a severe medical condition that, in the view of the principal investigator, prohibited participation.
The majority of patients received induction therapy with Basiliximab (Simulect®, Novartis Co, East Hanover, NJ), and a few with rabbit anti-thymocyte globulin (r-ATG, Thymoglobulin®, Genzyme, Cambridge, MA) as shown in Table 1. Doses of both agents were adjusted according to white blood cell count and gastrointestinal symptom rating scale (GSRS), [17] a validated instrument measuring gastrointestinal symptoms.
Data were collected at screening, on the day of transplantation, at week 2 and months 1, 3 and 6 after transplantation. Laboratory tests included a complete blood count and a complete metabolic panel. All adverse events related to study medications and dose changes were noted, including dyslipidemia, anemia and leukopenia, infection and new-onset diabetes mellitus. Also recorded were biopsy proven rejection episodes, and gastrointestinal adverse events by GSRS scores. Estimated Glomerular Filtration Rates (eGFR) were calculated using the simplified Modification of Diet in Renal Diseases (MDRD) formula.
Patients were analyzed using a GSRS as previously described by Lamas, et al. [21] The GSRS was designed to assess the severity of symptoms associated with common GI disorders and was formerly validated in renal transplant recipient [22]. The GSRS, a self-administered questionnaire, includes 15 items and uses a 7-grade Likert scale, where 1 represents “no discomfort” and 7 represents “very severe discomfort”. The items were grouped into five dimensions: abdominal pain (abdominal pain, nausea and hunger pains), acid reflux (acid regurgitations, heartburn), indigestion (borborygmus, abdominal distension, eructation and flatus), diarrhea (diarrhea, loose stools, and urgent need for defecation) and constipation (constipation, hard stools, and feeling of incomplete evacuation). Patients were asked to fill out the questionnaire at each clinic visit, at baseline week 1, week 2, 3 months and 6 months post-transplantation.
The total GSRS scores were calculated at each time point for the 5 different subcategories. Total scores were then calculated for each patient by adding up all scores from all time points.
The following definitions were used in this study:
New Onset Post Transplant Diabetes Mellitus (NOPTDM)- was defined in patients who (Figure 1a) were not diabetic prior to transplant and (Figure 1b) who, beyond the first 30 days after transplant, had persistently elevated fasting blood glucose levels > 126mg/dl and/or who required treatment for hyperglycemia.
Data were analyzed by the Kruskal-Wallis non-parametric test and by Chi square analysis. Differences were considered to be statistically significant at the p< 0.05 level. The GSRS scores were considered as aggregate scores or as sub-scores based on (1) abdominal pain, (2) acid reflux, (3) indigestion, (4) diarrhea and (5) constipation.
Demographic and clinical characteristics are shown in Table 1. The final cohort was composed of 61 patients in the MMF group and 69 patients in the EC-MPS group. Overall, 64.7 % of patients were men, and 65.1 % were Hispanic. Mean weight was 74.1 kg and was statistically difference between MMF and EC-MPS groups. Overall, 93.2 % patients had a history of hypertension; a similar portion of MMF (95.1%) and EC-MPS (92.8%) patients had diabetes. The proportion of patients receiving tacrolimus or cyclosporine was also similar between two groups. There was no difference between the MMF and EC-MPS groups in terms of delayed graft function and induction therapy (Table 1).
There were fewer EC-MPS patients who required mycophenolate dose reductions compared with MMF patients, both overall (20.3% vs. 37.1%, p=0.045) and at 1 and 3 months (2.9% vs. 16.4%, p=0.008 and 7.3% vs. 29.5%, p=0.001, respectively) (Figure 1 and Table 2).
The composite GSRS scores (Table 2) were lower at 6 months in the EC-MPS arm, but not at earlier time points. Lower GSRS scores are desirable since they indicate a lower burden of symptom. Dose reduction was not associated with GSRS scores in patients using either formulation of mycophenolate (Table 2). At 6 months, the GSRS sub-scale scores for abdominal pain (p=0.056), indigestion (p=0.051) and constipation (p=0.041) were marginally lower in the EC-MPS-treated patients (Table 3).
The overall incidence of adverse events was the same in MMF and EC-MPS-treated recipients (Table 4). Furthermore, there was no difference in the incidence of adverse events in patients who did or did not require mycophenolate dose reduction, regardless of which arm of the trial they were in (Table 4). Graft function defined by serum creatinine or glomerular filtration rate, was not significant different between groups, with a mean 6 months eGFR of 70±23 mL/min in the MMF group and 67±18 mL/mn in the EC-MPS group (0.748) (Table 5). Acute allograft dysfunction, identified as a clinically significant increase in serum creatinine, precipitated graft biopsies. The number of biopsy-proven rejection episodes was consistently lower in the EC-MPS-treated patients than in those receiving MMF. This was true at all time points, but the differences did not reach statistical significance (Table 6).
Immunosuppressive regimens requiring dosage adjustments have been shown to have negative outcomes in kidney transplant recipients [10]. The principal findings in this study were fewer dose adjustments in the EC-MPS patients along with fewer episodes of acute allograft dysfunction and biopsy-proven rejection in patients treated with EC-MPS compared with MMF.
The patients in the two arms of this study were well matched. This includes demographics, pre-transplant medical history and sensitization (Table 1). The patients in the EC-MPS arm were significantly heavier than the comparison group, but this is unlikely to confound the study. The overall equivalent daily doses were not significantly different in both groups. There were no differences between the groups in any parameter related to the donors or the surgery, HLA matching and early post-transplant function (Table 1). Overall, there were no differences in the use of induction therapy (Table 1) or in the choice of maintenance immunosuppression in the two study arms. Some studies have suggested that the combination of mycophenolate with tacrolimus might increase the incidence of gastrointestinal side effects compared with mycophenolate and cyclosporine [19,20]. However, a previously published substudy on the SVMC group of patients treated with cyclosporine (n=24) or tacrolimus (n=43) showed no significant differences, either for overall GSRS scores (24.8 ± 8.9 vs. 26.5 ± 9.0, respectively, p=0.17) or for the diarrhea subscore (3.8 ± 1.6 vs 5.1 ± 3.4, respectively, p=0.09) [23]. Therefore, given the good matching of the patients in the two arms of this study, it is highly probable that any differences between the two arms are due to differences in response to the two formulations of mycophenolate used, namely MMF and EC-MPS.
The strategy employed in this study was to start with the highest recommended bioequivalent doses, 1000mg MMF and 720mg EC-MPS, orally BID. Doses were reduced only as required according to an algorithm based on white blood cell counts or intolerable gastrointestinal side effects.
Dose reductions were required significantly less frequently in the patients treated with EC-MPS (Figure 2 and Table 2). This was true in the first 3 months (p< 0.001). The first 3 month after kidney transplant appears to be an important period in terms of clinical events. The majority of acute rejection episode occurs in this period [24] and subsequently requires rejection treatment and higher antibody product use, which may trigger opportunistic infections. However, there were no differences in hematological adverse events between patients in the two arms, suggesting that the difference in drug reduction was not due to myelotoxicity. Indeed, there were no differences in any adverse event, either between the EC-MPS and MMF arms, or between patients who required dose reduction and those who did not (Table 4). Even the side effects that might be related to mycophenolate therapy, such as anemia, leukopenia and infection, were not different. In addition, the adverse effects of steroids and calcineurin inhibitors, such as dyslipidemia, leukocytosis and NOPTDM, evidently were not exacerbated by concomitant treatment with either MMF or EC-MPS. These adverse events were defined by the objective measurements of blood cells and chemistry. Therefore, these side effects evidently were not the reason for dose reductions.
Therefore, on aggregate, there is little in our data to suggest that EC-MPS has an advantage over MMF in terms of the GSRS scores. Nevertheless, there were fewer dose reductions in patients treated with EC-MPS, suggesting that EC-MPS really is better tolerated. If, as argued above, dose reductions were not due to hematological or clinical chemistry abnormalities, then they may have been a consequence of gastrointestinal problems. These gastrointestinal disturbances were not well reflected by the subjective, patient self-administered GSRS questionnaire. Instead, they were assessed by the transplant physicians and treatment changes were made according to their judgment, based on the patients’ description of gastrointestinal symptoms.
Despite the paucity of data to provide an explanation for the dose reductions that did occur (Figure 2 and Table 2), at 3 months only 5/69 (7.3%) patients in the EC-MPS arm had undergone dose reduction compared with 18/61 (29.5%) of patients treated with MMF (p= 0.001). In fact, nearly 80% of patients given the maximum dose of EC-MPS stayed on that dose throughout the study period (Figure 2 and Table 2), presumably reflecting greater tolerance of the EC-MPS formulation.
The major objective in maintaining high therapeutic doses of mycophenolate is to improve outcome. In terms of serum creatinine levels at all time points or eGFR at months 1, 3 and 6, there was no apparent difference between the MMF and EC-MPS groups, despite the difference in mycophenolate dose reductions (Table 2). By contrast, there were almost twice as many episodes of acute allograft dysfunction, defined by a rise in serum creatinine, in the MMF arm compared with the EC-MPS arm (Table 6). Sampling at fixed time points clearly missed acute and transient events.
A recently published retrospective single center study compared the dose adjustments and outcomes of the two formulations of mycophenolate in kidney transplant recipients [25]. The authors concluded that EC-MPS was associated with fewer dose adjustments and this was felt to be the plausible explanation for a lower incidence of biopsy-proven acute rejection noted in the EC-MPS group. These observations are consistent with the conclusions of our prospective study. The incidence of biopsy-proven acute rejection was twice as high in patients in the MMF arm compared with the EC-MPS arm, and the episodes that did occur in the EC-MPS patients were later in onset (Table 6). However, the total number of episodes is low and these apparent differences did not achieve significance. Nevertheless, from the tolerability standpoint, a greater percentage of patients in the EC-MPS arm remained on a full dose in our study as well.
In many patients there appears to be only a small difference between the therapeutic level and the tolerated level. Thus the dosage and outcomes observations may be linked by the possibility that the higher therapeutic levels are maintained in the EC-MPS treated patients because the enteric-coated formulation is better tolerated. Our findings are compatible with the evidence that mycophenolate dose reduction is associated with worse outcomes [9,10]. In a conclusion, both MMF and EC-MPS are clinically similar, however, patients treated with EC-MPS require less dose reduction and have fewer rejection episodes, compared with MMF, especially in an early clinically important transplant period.
This study was funded by an investigator-lead research grant to the Mendez National Institute of Transplantation (Principal Investigator, Dr Tariq Shah) from Novartis Co.

![]()

|
|
MMF (n=61) |
EC-MPS (n=69) |
P value |
Age (years) |
|
46.7 ± 12.1 |
47.9 ± 13.6 |
0.576 |
Gender (male) |
|
41 (67.2%) |
43 (62.3%) |
0.560 |
Ethnicity |
White |
6 (9.8%) |
12 (17.7%) |
0.278 |
|
African American |
5 (8.2%) |
5 (7.3%) |
0.851 |
|
Hispanic |
41 (67.2%) |
43 (63.2%) |
0.787 |
|
Other |
9 (14.8%) |
8 (11.8%) |
0.640 |
Pre-transplant diabetes |
|
23 (37.7%) |
18 (26.9%) |
0.189 |
Pretransplant hypertension |
|
58 (95.1%) |
64 (92.8%) |
0.581 |
Pre-transplant transfusion |
|
12 (19.7%) |
13 (18.8%) |
0.940 |
Peak PRA (%)* |
|
4.4 ± 12.4 |
0.3 ± 1.1 |
0.103 |
Weight (kg) |
|
71.4 ± 16.2 |
77.8 ± 16.9 |
0.021 |
Deceased donor |
|
30 (49.2%) |
31 (44.9%) |
0.771 |
Living donor |
|
31 (50.8%) |
38 (55.1%) |
0.882 |
Cold ischemia time (hours) |
|
9.5 ± 10.4 |
6.2 ± 7.6 |
0.089 |
HLA mis- match |
|
3.0 ± 2.2 |
2.9 ± 1.8 |
0.729 |
Immediate graft function |
|
33 (54.1%) |
47 (68.1%) |
0.101 |
Delayed graft function |
|
9 (14.8%) |
6 (8.7%) |
0.281 |
Calcineurin Inhibitors |
Cyclo- sporine |
19 (31.2%) |
24 (34.8%) |
0.660 |
Tacroli- mus |
38 (62.3%) |
41 (59.4%) |
0.738 |
|
No induction |
|
2 (3.3%) |
7 (10.1%) |
0.124 |
Thymoglobu- lin |
|
4 (6.6%) |
2 (2.9%) |
0.321 |
Simulect® |
|
55 (90.2%) |
60 (87.0%) |
0.568 |
| * Panel Reactive Antibody
Table 1: Characteristics of recipients treated with MMF or EC-MPS |
||||
|
MMF group (n=61) |
EC-MPS group (n=69) |
P value |
Dose Reduction |
|||
Never |
39 (63.9%) |
55 (79.7%) |
0.045 |
Within 2 weeks |
3 (4.9%) |
0 (0%) |
0.062 |
Within 1 month |
10 (16.4%) |
2 (2.9%) |
0.008 |
Within 3 months |
18 (29.5%) |
5 (7.3%) |
0.001 |
Within 6 months |
21 (34.3%) |
14 (20.3%) |
0.070 |
Gastrointestinal Symptoms Rating Scale (GSRS) Dose Reduction |
|||
Initial |
21.5 ± 6.7 (n=61) |
22.0 ± 6.9 (n=68) |
0.689 |
At 2 weeks |
23.8 ± 8.8 (n=60) |
22.7 ± 8.4 (n=60) |
0.577 |
At 3 months |
21.5 ± 8.2 (n=51) |
22.6 ± 9.6 (n=46) |
0.556 |
At 6 months |
24.3 ± 10.7 (n=49) |
21.5 ± 12.9 (n=46) |
0.046 |
GSRS in patients with no dose reduction |
|||
Initial |
21.4 ± 6.4 (n=38) |
22.6 ± 7.2 (n=51) |
0.466 |
At 2 weeks |
22.2 ± 7.5 (n=39) |
23.5 ± 9.2 (n=47) |
0.718 |
At 3 months |
20.9 ± 7.6 (n=32) |
23.6 ± 10.5 (n=44) |
0.230 |
At 6 months |
25.0 ± 12.0 (n=30) |
19.9 ± 8.8 (n=35) |
0.032 |
GSRS in patients who required dose reduction |
|||
Initial |
21.8 ± 7.5 (n=20) |
20.1 ± 5.7 (n=15) |
0.674 |
At 2 weeks |
26.5 ± 10.4 (n=21) |
19.9 ± 3.1 (n=13) |
0.101 |
At 3 months |
22.6 ± 9.3 (n=19) |
19.4 ± 4.7 (n=13) |
0.375 |
At 6 months |
23.1 ± 8.4 (n=19) |
26.8 ± 21.2 (n=11) |
0.966 |
| Table 2: Dose reduction and GSRS scores in patients treated with MMF or EC-MPS | |||
|
MMF group |
EC-MPS group |
P value |
GSRS subscale 1: Abdominal pain |
|||
Initial |
4.1 ± 1.9 (n= 60) |
4.2 ± 2.2 (n= 68) |
0.469 |
At 2 weeks |
5.1 ± 2.6 (n= 61) |
4.8 ± 2.0 (n= 63) |
0.724 |
At 3 months |
4.4 ± 2.3 (n= 53) |
4.8 ± 2.8 (n= 58) |
0.414 |
At 6 months |
4.7 ± 2.2 (n= 49) |
4.3 ± 3.0 (n= 47) |
0.056 |
GSRS subscale 2: Acid reflux |
|||
Initial |
2.5 ± 1.0 (n= 60) |
2.9 ± 1.6 (n= 68) |
0.122 |
At 2 weeks |
2.4 ± 0.8 (n=61) |
2.3 ± 1.0 (n=63) |
0.342 |
At 3 months |
2.9 ± 2.0 (n= 53) |
2.3 ± 0.7 (n= 58) |
0.033 |
At 6 months |
3.3 ± 2.4 (n=49) |
2.8 ± 1.9 (n=47) |
0.133 |
GSRS subscale 3: Indigestion |
|||
Initial |
5.8 ± 2.5 (n=59) |
6.1 ± 2.6 (n=68) |
0.574 |
At 2 weeks |
6.9 ± 3.1 (n= 61) |
7.0 ± 3.6 (n= 63) |
0.913 |
At 3 months |
5.9 ± 2.6 (n=51) |
6.5 ± 2.9 (n=59) |
0.146 |
At 6 months |
6.7 ± 3.5 (n=49) |
6.0 ± 3.9 (n= 47) |
0.051 |
GSRS subscale 4: Diarrhea |
|||
Initial |
4.0 ± 2.0 (n=59) |
3.8 ± 1.8 (n=68) |
0.631 |
At 2 weeks |
4.3 ± 3.1 (n=60) |
4.0 ± 2.1 (n= 61) |
0.655 |
At 3 months |
4.3 ± 2.7 (n=53) |
4.8 ± 3.3 (n= 59) |
0.262 |
At 6 months |
4.3 ± 2.3 (n=49) |
4.3 ± 2.9 (n= 47) |
0.507 |
GSRS subscale 5: Constipation |
|||
Initial |
5.1 ± 3.1 (n= 60) |
5.1 ± 2.8 (n= 66) |
0.484 |
At 2 weeks |
5.2 ± 3.0 (n=61) |
5.1 ± 3.1 (n=61) |
0.812 |
At 3 months |
4.1 ± 1.7 (n= 53) |
4.2 ± 2.0 (n= 59) |
0.532 |
At 6 months |
5.2 ± 3.6 (n= 49) |
4.1 ± 2.2 (n= 46) |
0.041 |
| Table 3: GSRS subscale scores in patients treated with MMF or EC-MPS | |||
|
MMF (n=61) |
EC-MPS (n=69) |
P value |
Cumulative incidences at 6 months of adverse events |
|||
Hyperlipidemia |
8 (13.1%) |
11 (16.2%) |
0.624 |
Hypercholesterolemia |
9 (15.0%) |
7 (10.5%) |
0.444 |
Anemia |
56 (91.8%) |
59 (85.5%) |
0.262 |
Leukopenia |
18 (29.1%) |
20 (29.0%) |
0.948 |
Leukocytosis |
34 (55.7%) |
39 (56.5%) |
0.928 |
Hyperkalemia |
1 (1.6%) |
4 (5.8%) |
0.219 |
Infection |
10 (16.4%) |
10 (14.5%) |
0.764 |
NOPTDM |
1 (1.6%) |
1 (1.5%) |
0.930 |
Cumulative incidences at 6 months of adverse events in patients who re- quired dose reduction |
|||
Hyperlipidemia |
6 (15.4%) |
10 (18.9%) |
0.663 |
Hypercholesterolemia |
5 (12.8%) |
7 (13.0%) |
0.984 |
Anemia |
35 (89.7%) |
46 (85.2%) |
0.518 |
Leukopenia |
9 (23.1%) |
15 (27.8%) |
0.609 |
Leukocytosis |
23 (59.0%) |
28 (51.9%) |
0.496 |
Hyperkalemia |
0 (0.0%) |
2 (3.7%) |
0.224 |
Infection |
4 (10.3%) |
5 (9.3%) |
0.872 |
NOPTDM |
1 (2.6%) |
1 (1.9%) |
0.815 |
| Table 4: Cumulative incidence at 6 months of adverse events in patients treated with MMF or EC-MPS | |||
|
Day 0 |
5 days |
2 weeks |
1 month |
3 months |
6 months |
Serum Creatinine (mg/dL) |
||||||
MMF (n=61) |
8.6 ± 3.1 |
3.0 ± 2.8 |
2.0 ± 2.1 |
1.5 ± 1.3 |
1.3 ± 0.4 |
1.2 ± 0.4 |
EC-MPS (n=69) |
8.7 ± 3.9 |
2.2 ± 2.1 |
1.4 ± 0.4 |
1.3 ± 0.4 |
1.3 ± 0.4 |
1.2 ± 0.4 |
P value |
0.967 |
0.169 |
0.222 |
0.805 |
0.808 |
0.800 |
Estimated Glomerular Filtration Rate (mL/min) |
||||||
MMF |
|
|
|
54 ±23 |
65 ± 24 |
70 ± 23 |
EC-MPS |
|
|
|
59 ± 19 |
63 ± 17 |
67 ± 18 |
P value |
|
|
|
0.311 |
0.687 |
0.748 |
| Table 5: Serum creatinine levels and glomerular filtration rate in patients treated with MMF or EC-MPS | ||||||
|
MMF (n=61) |
EC-MPS (n=69) |
P value |
Cumulative incidence of biopsy events for suspected acute rejection |
|||
5 days |
1 (1.6%) |
0 (0.0%) |
0.286 |
2 weeks |
2 (3.3%) |
0 (0.0%) |
0.130 |
1 month |
5 (8.2%) |
2 (2.9%) |
0.182 |
3 months |
11 (18.0%) |
5 (7.3%) |
0.062 |
6 months |
12 (19.7%) |
8 (11.6%) |
0.203 |
Cumulative incidence of acute rejection |
|||
5 days |
2 (3.3%) |
0 (0.0%) |
0.130 |
2 weeks |
3 (4.9%) |
0 (0.0%) |
0.062 |
1 month |
4 (6.6%) |
2 (2.9%) |
0.321 |
3 months |
8 (13.1%) |
4 (5.8%) |
0.150 |
6 months |
9 (14.8%) |
6 (8.7%) |
0.281 |
| Table 6: Biopsy events and acute rejection in patients treated with MMF or EC-MPS | |||
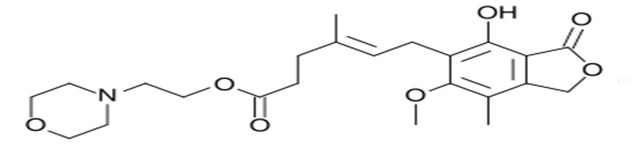 |
| Figure 1a: Chemical structure, a: mycophenolate mofetil (Cellcept®) |
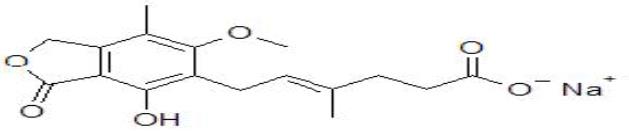 |
| Figure 1b: Mycophenolic acid sodium (enteric coated mycophenolic acid, Myfortic®) |
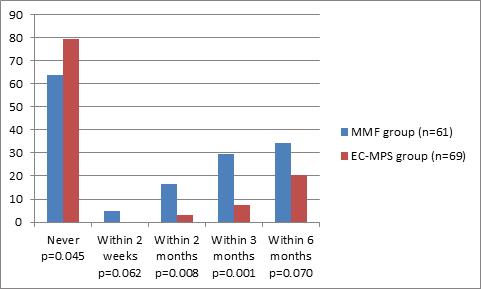 |
| Figure 2: Patients (cumulative percentage) treated with MMF or EC-MPS in whom doses were reduced at different times after transplantation. |


